Analysis updated 20-05-20
For the analysis here I select a few countries of particular interest to me:
clist  = ["Argentina" "Belgium" "Brazil" "Norway" "Panama" "Spain" "Sweden" "Thailand"]
plist  = [45.195774,  11.589623, 212.559417, 5.421241,4.314767, 46.754778, 10.099265, 67.799978]
The numbers are country population fetched from Worldometer.info
Impact
How hard hit are these countries?
Let us look at the number of deaths per million inhabitants.
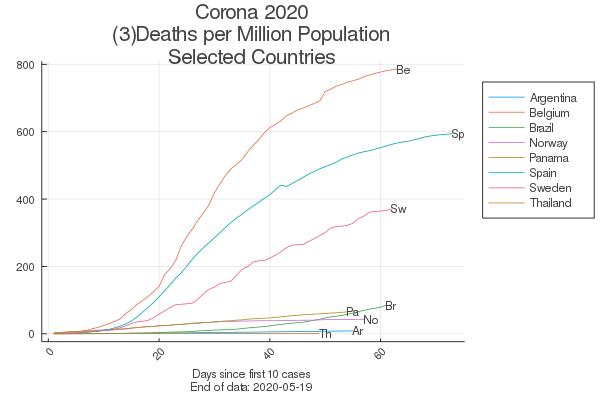
The most striking feature is the large dispersion. This immediately asks for explanations. A list of explaining factors might include: population density, urbanization, demography, general health conditions, commuting and travel, quality of public Health Services, air pollution, social habits of interaction, etc. Then there are obvious differences in how the statistics are registered in different countries - some are more ‘clever at counting’ than others. Often mentioned has also been different degrees of antibiotics resistence - many deaths are due to secondary infections in addition to the coronavirus. Anyway we should be very carefull in comparing levels of registered deaths among countries. Indeed, to get at the real corona mortality one might need to look into funeral statistics. Excess deaths per week (2020 compared to years before) has surged during the pandemic period for many countries, as reported by Finacial Times. Of our sample countries Belgium had 57% excess mortality on this score, Norway 0%, Spain 49% and Sweden 30%. So the differences between countries prevail, even on this measure.
Epidemimological models simplifies all such factors into some contact parameters - or transmission probalilities. A contagious person is asumed to spread the virus to others through direct or indirect physical contact. How easily this takes place is also dependent on the specific virus in question. Where the new Corona (SARS2-Covid-19) virus stays on this scale is not yet known with certainty - may be more contagious than ‘ordinary’ influenza.
Epidemological models are compartmental. They put the population into bins and model how people move between the bins, taking demographics and physical mobility into consideration. How the bins are delineated may differ, simple SIR (Susceptible, Infected, Recovered) or more complex. NIPH, The Norwegian Institute of Public Health, applies a detailed model with compartments:
- \(S\) - Suscpetible,
- \(E_{1}\) - Exposed, not infectious, no symptoms
- \(E_{2}\) - Exposed, presymptomatic, infectious
- \(I_{a}\) - Infectious, asympotmatic
- \(I\) - Infectious, sympotmatic
- \(R\) - Recovered
In this model geographic resolution is very detailed - at the municipality level. Commuting is considered - people staying in one zone at day (workplace) and another at night (domicile) carrying the virus around. Other models might include compartments for Hospitalized, Under Incentive Care, etc. Our curve above shows the number of Deaths, not included in many models, rather treated as a residual category. How detailed and which compartments the model includes is of course dependent on it’s intended use. Most models are developed by public health authorities with epidemic management under outbreaks as the focal issue - i.e. the capacity of hospitals to handle the infected and sick, or on vaccine issues. The focus here is more macro - how and why the epidemic progresses so differently in different countries.
Infectiousness
How is the infectiousness of the epidemic changing over time?
Let us look at the effective reproduction number \(R_{eff}\). This number is calculated from the daily differences in reported confirmed cases and so avoids the problem of comparing levels between countries.
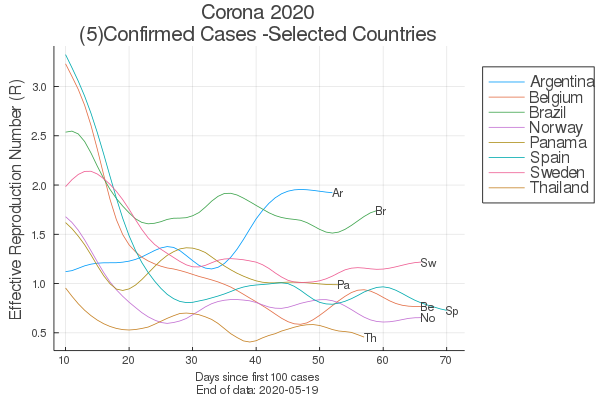
Again, the most striking feature is the large dispersion. The goal of the Public Health Authorities is to get the reproduction number under 1.0 as fast as possible, and keep it there so the epidemic gradually dies out. How fast? The table shows number of days (since first 100 confirmed cases) till \(R_{eff}\) gets under 1.0 and stays there.
| Country | Days |
|---|---|
| Thailand | 10 |
| Norway | 18 |
| Spain | 25 |
| Belgium | 35 |
| Panama | 50 |
Argentina stays at 1.92 after 52 days, Brazil at 1.74 after 59 days and Sweden at 1.22 after 66 days. (data updated 200519). Even worse, Argentina seems to have been on a worrying upwards trend for a long period (10-50 days), and Brazil is again pointing up at around day 60. Only Panama has had a clear second wave days 20-40, but has come down to around 1.0 since.
Explanations
How can such differences be explained?
Belgium is at the top on our impact measure - with 786 deaths per million population. On our containment measure they score in the middle with 35 days. I do not have specific information on the Belgian epidemic management, so this factor remains open here. But Belgium is a densely populated and highly urbanized country as well a a major traffic hub with the EU institutions in Brussels. Anectodal evidence suggests that part of the explanation for Belgiums high death toll is mostly differences in statistical registration?
Spain scores second on our impact measure - with 594 deaths per million population. With 25 days the reproduction number in Spain was brought down much quicker than in Belgium. This might explain the lesser impact, although much higher than in the rest of the sample countries. The deaths in Spain are very concentrated, mainly to Madrid and Barcelona. And they are concentrated in the Elderly Care Institutions. I suspect two factors have played an important role: 1) Health Care Working conditions and 2) Pollution. Health care workers in Spain were told to stay on job in the early phase of the epidemic, neither could they afford to be home with light symptoms. Some 20-25% of all confirmed cases in Spain is hospital workers. In Norway they were from start told to stay home if they felt a little unwell. Madrid and Barcelona are heavily polluted regions - as are the European craddle in Lombardy. Ogen’s study [pdf reveils that the epidemic has been much worse in heavily polluted areas than elsewhere. If the virus is able to travel by attaching to microparticles in polluted air social distancing cannot cope. For Spain the celebrations of ‘Women’s Day’ 8 of March in Barcelona with large congregations in the beginning of the epidemic, but before lockdown (March 14) were a perfect timing of a superspread event.
Sweden scores third on our impact measure - with 371 deaths per million population - and has yet to get the reproduction number -as we calculate it- under 1.0, as of day 66. Sweden deliberately choosed an openness strategy - aiming to fast gain herd immunity, with much weaker lockdown measures, if at all. We do not have numbers for percentage of people who have gained immunity (nor for how long) - only future studies can bring forward such figures. So eeven if the Swedish strategy will end up as the best in the long run, it certainly has big costs in the shorter term. Turchin consideres these issues in a comparision with Denmark (not in our sample) without reaching any firm conclusion. Similar to Spain, Sweden seems to have a lot of deaths concentrated in Elderly Care Institutions. Sweden has a very large immigrant population with a mixture of nationalities working in such institutions - a factor that may have complicated the enforcement of strict and new regimes of hygiene and behaviour due to the virus risks.
Norway (together with Denmark) quickly introduced lockdown measures (although not as heavily as Spain) and also fast got the reproduction number under the critical level (18 days). One of the first confirmed cases were identified by a doctor in a major hospital returning from ski-holiday. The Hospital administration asked him to stay on work even if he had mild symptoms and wanted to stay home. This initial error forced several hundreds patients and hospital workers into quaranteen and caused major alarm. After that very strict measures to keep potentially contagious personell at home. Norway thus have a much lower death rate in institutions for elderly than Sweden.
Panama looks like the epidemic is underway to be contained.
Brazil do not have control and the epidemic is progressing fastly.
Argentina seems to be on a very bad course.
Thailand seems to be a success story - however, the very low numbers over long time may point in the direction of weak data registration? May be the hot and humid climate keep the surge down?
Political Economy of Pandemics
Governments around the Globe have shown large differences in their pandemic response. However, the response has almost everywhere been by improvisation. Nowhere (may be apart from Finland) seems there to be a country with a well-prepared Pandemic Plan and adequate Health Service capacities. This is obvious not for lack of scientific warnings that Pandemies will arise although exact when cannot be foresaid.
How has this situation arised in the modern world? To answer this we have to broaden our perspective and look into the interplay of global economic development and it’s related Health System part.
Pyeyo (2020) Pandemic Politics pdf presents an interesting overview of this field.
Pyeyo’s major point is nicely caught in this quote:
Advanced ways to fight against infectious diseases have eased the development of dense urban conglomerates, industrial farms and quick transport all over the world, which represents an excellent culture medium for any infectious agent able to overcome the current protections.
This interconnectedness of the two processes of Nature’s Evolution and Humanity’s Development is like a weapon’s race. Changes on the one side are readily compensated by changes on the other side. The race goes on like Alice in Wonderland’s running to stand still (Pyemo’s allegory).
But the running goes in waves. For the last half century Humanity has mostly been running under the neoliberal dogma with such (temporal) success that we almost forgot that the other process were also running. Sherpa pdf shows that a policy of Austerity (health expenditure cuts) significantly increases the mortality rates of COVID-19 in OECDcountries. The policy implication of the study is the need for a robust public-funded health system with wider accessibility to deal with major public health crisis like COVID-19 pandemic.
Now the Corona pandemic opens a window of opportunity to get better politics in place. New pandemics - potentially more harmful than Covid-19 - will emerge in the future. Pyeyo suggests a preparation plan: an international agreement to be adopted by governments, affecting the economic activities most heavily involved in the origination, spread and cure of infectious diseases. This includes the creation of a Global Pandemic Prevention and Preparedness Fund under the auspices of the United Nations, funded from an internationally agreed tax on aviation. Aviation - in particular long-haul - being a business profiting on activities that spreads the virus without sharing the risks or costs of outbreaks. Also taxing industrial farming - another major source of pandemic risks - should be considered. The Fund would serve to upgrade public health systems - i.e. all mechanisms to monitor and respond to emerging infectious diseases) and finance programs to prevent the emergence of new infectious diseases.
Quite fundamentally - the Corona Outbreak and the prospects of more to come - calls for policies aiming at ending our present global high-speed society - creating a sounder society with less need to run fast to stand still.
Links:
Cori Time-Varying Reproduction Numbers (2013) pdf Methods pdf
Engebretsen Spread Model (Article) (2019) pdf
NIPH Coronavirus Modelling Web Page
NIPH Modelling Report 200516 (pdf) pdf
NIPH Spread Model Package on CranR
Ogen on Nitrogen Pollution and Corona pdf
Perings on Economics and Pandemic Risks pdf
Pyeyo (2020) Pandemic Politics pdf
Salje (2020) Estimating SARS-CoV-2 France pdf
Sherpa (2020) Austerity and COVID-19 Fatality pdf
Stier (2020) COVID-19 attack rate increases with citysize pdf