We pull the data from David Bumbeishvili’s Github Repository The reason for not using the John Hopkins data is that the Recovered series in this data was discontinued as of March 23, 2020. Bumbeishvili scrapes the data from Worldometer and performs some quality checks and corrections.
There are three csv files: Confirmed, Deaths and Recovered. Each file has one row for each geographical unit. There are 193 rows - starting with Afganistan and ending with Zimbabwe. The first four columns are 1) Province/State 2) Country/Region 3) Latitude 4) Longitude Then follows one column per date, starting January 22, 2020. The repository is updated daily. The downloaded files as used here can be accessed as follows: confirmed deaths recovered
For the analysis here I select a few countries of particular interest to me:
clist  = ["Argentina" "Belgium" "Brazil" "Norway" "Panama" "Spain" "Sweden" "Thailand"]
plist  = [45.195774,  11.589623, 212.559417, 5.421241,4.314767, 46.754778, 10.099265, 67.799978]
The numbers are country population fetched from Worldometer.info
For techical reasons I transpose the matrix and get a dataframe as follows. Julia only shows the first and last 15 rows. These are the data for confirmed cases:
julia> df_cfm
116×9 DataFrame
│ Row │ Date       │ Argentina │ Belgium │ Brazil   │ Norway  │ Panama  │ Spain    │ Sweden  │ Thailand │
│     │ Dates.Date │ Float64   │ Float64 │ Float64  │ Float64 │ Float64 │ Float64  │ Float64 │ Float64  │
├─────┼────────────┼───────────┼─────────┼──────────┼─────────┼─────────┼──────────┼─────────┼──────────┤
│ 1   │ 2020-01-22 │ 0.0       │ 0.0     │ 0.0      │ 0.0     │ 0.0     │ 0.0      │ 0.0     │ 2.0      │
│ 2   │ 2020-01-23 │ 0.0       │ 0.0     │ 0.0      │ 0.0     │ 0.0     │ 0.0      │ 0.0     │ 3.0      │
│ 3   │ 2020-01-24 │ 0.0       │ 0.0     │ 0.0      │ 0.0     │ 0.0     │ 0.0      │ 0.0     │ 5.0      │
│ 4   │ 2020-01-25 │ 0.0       │ 0.0     │ 0.0      │ 0.0     │ 0.0     │ 0.0      │ 0.0     │ 7.0      │
│ 5   │ 2020-01-26 │ 0.0       │ 0.0     │ 0.0      │ 0.0     │ 0.0     │ 0.0      │ 0.0     │ 8.0      │
│ 6   │ 2020-01-27 │ 0.0       │ 0.0     │ 0.0      │ 0.0     │ 0.0     │ 0.0      │ 0.0     │ 8.0      │
│ 7   │ 2020-01-28 │ 0.0       │ 0.0     │ 0.0      │ 0.0     │ 0.0     │ 0.0      │ 0.0     │ 14.0     │
│ 8   │ 2020-01-29 │ 0.0       │ 0.0     │ 0.0      │ 0.0     │ 0.0     │ 0.0      │ 0.0     │ 14.0     │
│ 9   │ 2020-01-30 │ 0.0       │ 0.0     │ 0.0      │ 0.0     │ 0.0     │ 0.0      │ 0.0     │ 14.0     │
│ 10  │ 2020-01-31 │ 0.0       │ 0.0     │ 0.0      │ 0.0     │ 0.0     │ 0.0      │ 1.0     │ 19.0     │
│ 11  │ 2020-02-01 │ 0.0       │ 0.0     │ 0.0      │ 0.0     │ 0.0     │ 1.0      │ 1.0     │ 19.0     │
│ 12  │ 2020-02-02 │ 0.0       │ 0.0     │ 0.0      │ 0.0     │ 0.0     │ 1.0      │ 1.0     │ 19.0     │
│ 13  │ 2020-02-03 │ 0.0       │ 0.0     │ 0.0      │ 0.0     │ 0.0     │ 1.0      │ 1.0     │ 19.0     │
│ 14  │ 2020-02-04 │ 0.0       │ 1.0     │ 0.0      │ 0.0     │ 0.0     │ 1.0      │ 1.0     │ 25.0     │
│ 15  │ 2020-02-05 │ 0.0       │ 1.0     │ 0.0      │ 0.0     │ 0.0     │ 1.0      │ 1.0     │ 25.0     │
⋮
│ 101 │ 2020-05-01 │ 4532.0    │ 49032.0 │ 92109.0  │ 7783.0  │ 6532.0  │ 242988.0 │ 21520.0 │ 2960.0   │
│ 102 │ 2020-05-02 │ 4681.0    │ 49517.0 │ 96559.0  │ 7809.0  │ 6720.0  │ 245567.0 │ 22082.0 │ 2966.0   │
│ 103 │ 2020-05-03 │ 4783.0    │ 49906.0 │ 101147.0 │ 7847.0  │ 7090.0  │ 247122.0 │ 22317.0 │ 2969.0   │
│ 104 │ 2020-05-04 │ 4887.0    │ 50267.0 │ 108266.0 │ 7904.0  │ 7197.0  │ 248301.0 │ 22721.0 │ 2987.0   │
│ 105 │ 2020-05-05 │ 5020.0    │ 50509.0 │ 114715.0 │ 7955.0  │ 7387.0  │ 250561.0 │ 23216.0 │ 2988.0   │
│ 106 │ 2020-05-06 │ 5208.0    │ 50781.0 │ 126611.0 │ 7996.0  │ 7523.0  │ 253682.0 │ 23918.0 │ 2989.0   │
│ 107 │ 2020-05-07 │ 5371.0    │ 51420.0 │ 135693.0 │ 8034.0  │ 7731.0  │ 256855.0 │ 24623.0 │ 2992.0   │
│ 108 │ 2020-05-08 │ 5611.0    │ 52011.0 │ 145892.0 │ 8070.0  │ 7868.0  │ 260117.0 │ 25265.0 │ 3000.0   │
│ 109 │ 2020-05-09 │ 5776.0    │ 52596.0 │ 156061.0 │ 8099.0  │ 8070.0  │ 262783.0 │ 25921.0 │ 3004.0   │
│ 110 │ 2020-05-10 │ 6034.0    │ 53081.0 │ 162699.0 │ 8105.0  │ 8282.0  │ 264663.0 │ 26322.0 │ 3009.0   │
│ 111 │ 2020-05-11 │ 6278.0    │ 53449.0 │ 169143.0 │ 8132.0  │ 8448.0  │ 268143.0 │ 26670.0 │ 3015.0   │
│ 112 │ 2020-05-12 │ 6563.0    │ 53779.0 │ 177602.0 │ 8157.0  │ 8616.0  │ 269520.0 │ 27272.0 │ 3017.0   │
│ 113 │ 2020-05-13 │ 6879.0    │ 53981.0 │ 189157.0 │ 8175.0  │ 8783.0  │ 271095.0 │ 27909.0 │ 3017.0   │
│ 114 │ 2020-05-14 │ 7134.0    │ 54288.0 │ 202918.0 │ 8196.0  │ 8944.0  │ 272646.0 │ 28582.0 │ 3018.0   │
│ 115 │ 2020-05-15 │ 7479.0    │ 54644.0 │ 218223.0 │ 8219.0  │ 9118.0  │ 274367.0 │ 29207.0 │ 3025.0   │
│ 116 │ 2020-05-16 │ 7805.0    │ 54989.0 │ 233142.0 │ 8237.0  │ 9268.0  │ 276505.0 │ 29677.0 │ 3025.0   │
These are the data for confirmed cases. The csv-file can be accessed here
For Death the data looks like this:
julia> df_dth
116×9 DataFrame
│ Row │ Date       │ Argentina │ Belgium │ Brazil  │ Norway  │ Panama  │ Spain   │ Sweden  │ Thailand │
│     │ Dates.Date │ Float64   │ Float64 │ Float64 │ Float64 │ Float64 │ Float64 │ Float64 │ Float64  │
├─────┼────────────┼───────────┼─────────┼─────────┼─────────┼─────────┼─────────┼─────────┼──────────┤
│ 1   │ 2020-01-22 │ 0.0       │ 0.0     │ 0.0     │ 0.0     │ 0.0     │ 0.0     │ 0.0     │ 0.0      │
│ 2   │ 2020-01-23 │ 0.0       │ 0.0     │ 0.0     │ 0.0     │ 0.0     │ 0.0     │ 0.0     │ 0.0      │
│ 3   │ 2020-01-24 │ 0.0       │ 0.0     │ 0.0     │ 0.0     │ 0.0     │ 0.0     │ 0.0     │ 0.0      │
│ 4   │ 2020-01-25 │ 0.0       │ 0.0     │ 0.0     │ 0.0     │ 0.0     │ 0.0     │ 0.0     │ 0.0      │
│ 5   │ 2020-01-26 │ 0.0       │ 0.0     │ 0.0     │ 0.0     │ 0.0     │ 0.0     │ 0.0     │ 0.0      │
│ 6   │ 2020-01-27 │ 0.0       │ 0.0     │ 0.0     │ 0.0     │ 0.0     │ 0.0     │ 0.0     │ 0.0      │
│ 7   │ 2020-01-28 │ 0.0       │ 0.0     │ 0.0     │ 0.0     │ 0.0     │ 0.0     │ 0.0     │ 0.0      │
│ 8   │ 2020-01-29 │ 0.0       │ 0.0     │ 0.0     │ 0.0     │ 0.0     │ 0.0     │ 0.0     │ 0.0      │
│ 9   │ 2020-01-30 │ 0.0       │ 0.0     │ 0.0     │ 0.0     │ 0.0     │ 0.0     │ 0.0     │ 0.0      │
│ 10  │ 2020-01-31 │ 0.0       │ 0.0     │ 0.0     │ 0.0     │ 0.0     │ 0.0     │ 0.0     │ 0.0      │
│ 11  │ 2020-02-01 │ 0.0       │ 0.0     │ 0.0     │ 0.0     │ 0.0     │ 0.0     │ 0.0     │ 0.0      │
│ 12  │ 2020-02-02 │ 0.0       │ 0.0     │ 0.0     │ 0.0     │ 0.0     │ 0.0     │ 0.0     │ 0.0      │
│ 13  │ 2020-02-03 │ 0.0       │ 0.0     │ 0.0     │ 0.0     │ 0.0     │ 0.0     │ 0.0     │ 0.0      │
│ 14  │ 2020-02-04 │ 0.0       │ 0.0     │ 0.0     │ 0.0     │ 0.0     │ 0.0     │ 0.0     │ 0.0      │
│ 15  │ 2020-02-05 │ 0.0       │ 0.0     │ 0.0     │ 0.0     │ 0.0     │ 0.0     │ 0.0     │ 0.0      │
⋮
│ 101 │ 2020-05-01 │ 225.0     │ 7703.0  │ 6410.0  │ 210.0   │ 188.0   │ 24824.0 │ 2653.0  │ 54.0     │
│ 102 │ 2020-05-02 │ 237.0     │ 7765.0  │ 6750.0  │ 211.0   │ 192.0   │ 25100.0 │ 2669.0  │ 54.0     │
│ 103 │ 2020-05-03 │ 246.0     │ 7844.0  │ 7025.0  │ 211.0   │ 197.0   │ 25264.0 │ 2679.0  │ 54.0     │
│ 104 │ 2020-05-04 │ 260.0     │ 7924.0  │ 7343.0  │ 214.0   │ 200.0   │ 25428.0 │ 2769.0  │ 54.0     │
│ 105 │ 2020-05-05 │ 264.0     │ 8016.0  │ 7921.0  │ 215.0   │ 203.0   │ 25613.0 │ 2854.0  │ 54.0     │
│ 106 │ 2020-05-06 │ 273.0     │ 8339.0  │ 8588.0  │ 216.0   │ 210.0   │ 25857.0 │ 2941.0  │ 55.0     │
│ 107 │ 2020-05-07 │ 282.0     │ 8415.0  │ 9188.0  │ 217.0   │ 218.0   │ 26070.0 │ 3040.0  │ 55.0     │
│ 108 │ 2020-05-08 │ 293.0     │ 8521.0  │ 9992.0  │ 218.0   │ 225.0   │ 26299.0 │ 3175.0  │ 55.0     │
│ 109 │ 2020-05-09 │ 300.0     │ 8581.0  │ 10656.0 │ 219.0   │ 231.0   │ 26478.0 │ 3220.0  │ 56.0     │
│ 110 │ 2020-05-10 │ 305.0     │ 8656.0  │ 11123.0 │ 219.0   │ 237.0   │ 26621.0 │ 3225.0  │ 56.0     │
│ 111 │ 2020-05-11 │ 314.0     │ 8707.0  │ 11625.0 │ 224.0   │ 244.0   │ 26744.0 │ 3256.0  │ 56.0     │
│ 112 │ 2020-05-12 │ 319.0     │ 8761.0  │ 12404.0 │ 228.0   │ 249.0   │ 26920.0 │ 3313.0  │ 56.0     │
│ 113 │ 2020-05-13 │ 329.0     │ 8843.0  │ 13158.0 │ 229.0   │ 252.0   │ 27104.0 │ 3460.0  │ 56.0     │
│ 114 │ 2020-05-14 │ 353.0     │ 8903.0  │ 13993.0 │ 232.0   │ 256.0   │ 27321.0 │ 3529.0  │ 56.0     │
│ 115 │ 2020-05-15 │ 356.0     │ 8959.0  │ 14817.0 │ 232.0   │ 260.0   │ 27459.0 │ 3646.0  │ 56.0     │
│ 116 │ 2020-05-16 │ 363.0     │ 9005.0  │ 15633.0 │ 232.0   │ 266.0   │ 27563.0 │ 3674.0  │ 56.0     │
The csv-file with data for number of deaths can be accessed here
To get an idea of how this data looks I make some simple plots:
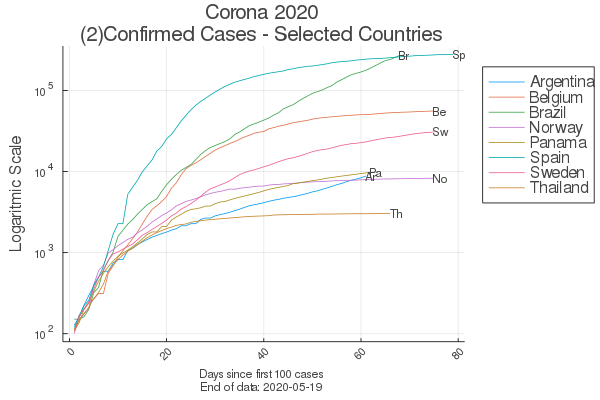
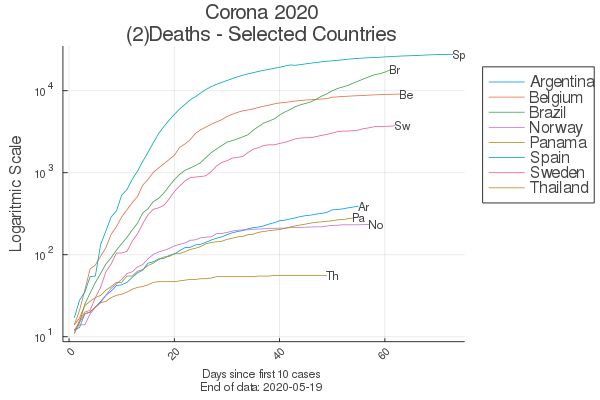
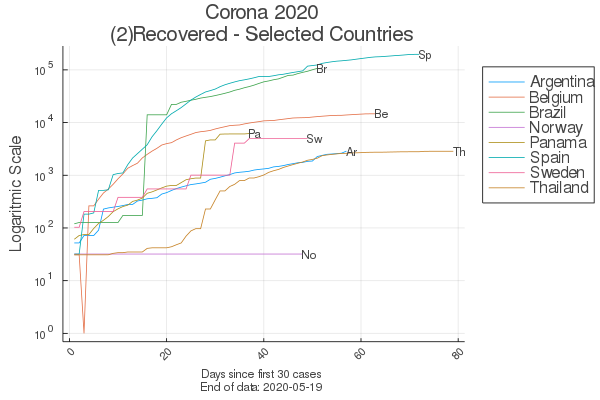
The immediate impression is that the data looks like typical epidemic outbreaks, although the various countries are in dirrent phases and differently hard hit. The data for recovered obviously are of less quality and irregular/lack of reporting. The csv-file with data for number of recovered can be accessed here
Go to the Analysis Chapter