6 Tipping
Wunderling Abstract
With progressing global warming, there is an increased risk that one or several tipping elements in the climate system might cross a critical threshold, resulting in severe consequences for the global climate, ecosystems and human societies. While the underlying processes are fairly well-understood, it is unclear how their interactions might impact the overall stability of the Earth’s climate system. As of yet, this cannot be fully analysed with state-of-the-art Earth system models due to computational constraints as well as some missing and uncertain process representations of certain tipping elements. Here, we explicitly study the effects of known physical interactions among the Greenland and West Antarctic ice sheets, the Atlantic Meridional Overturning Circulation (AMOC) and the Amazon rainforest using a conceptual network approach. We analyse the risk of domino effects being triggered by each of the individual tipping elements under global warming in equilibrium experiments. In these experiments, we propagate the uncertainties in critical temperature thresholds, interaction strengths and interaction structure via large ensembles of simulations in a Monte Carlo approach. Overall, we find that the interactions tend to destabilise the network of tipping elements. Furthermore, our analysis reveals the qualitative role of each of the four tipping elements within the network, showing that the polar ice sheets on Greenland and West Antarctica are oftentimes the initiators of tipping cascades, while the AMOC acts as a mediator transmitting cascades. This indicates that the ice sheets, which are already at risk of transgressing their temperature thresholds within the Paris range of 1.5 to 2 ∘C, are of particular importance for the stability of the climate system as a whole.
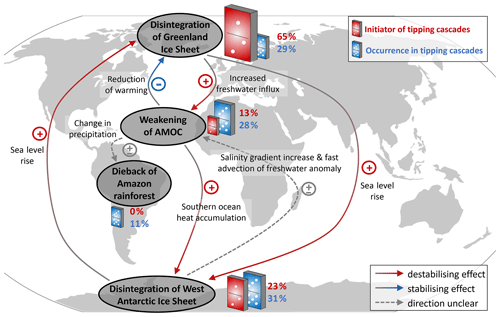
Risk increases significantly when considering interactions between these climate tipping elements and that these interactions tend to have an overall destabilising effect. Altogether, with the exception of the Greenland Ice Sheet, interactions effectively push the critical threshold temperatures to lower warming levels, thereby reducing the overall stability of the climate system. The domino-like interactions also foster cascading, non-linear responses. Under these circumstances, our model indicates that cascades are predominantly initiated by the polar ice sheets and mediated by the AMOC. Therefore, our results also imply that the negative feedback loop connecting the Greenland Ice Sheet and the AMOC might not be able to stabilise the climate system as a whole.
6.1 Tipping Points in Clouds
Johnson
Hysteresis
The word “hysteresis” doesn’t immediately seem threatening; it hints at a portmanteau of “history” and “thesis”—a dense read, perhaps, but those never killed anyone. But that’s not what the word means. Hysteresis is a profound behavior some systems can display, crossing a sort of point-of-no-return. Dial things up just one notch, and you can push the system through a radical change. To get back to normal, you might have to dial it down five or six notches.
Earth’s climate system can provide examples. Take the conveyor-belt-like circulation of water in the Atlantic Ocean. Looking back at the past, you can see times that the circulation seems to have flipped into an alternate pattern regarding climatic consequences around the North Atlantic. Switching from one pattern to the other takes a significant nudge, but reversing it is hard—like driving up to the top of a ridge and rolling down into the next valley.
A new study led by Caltech’s Tapio Schneider may have identified a disturbing hysteresis in Earth’s climate—a shift in cloud patterns in response to warming that could quickly heat the planet much further. If we were to continue emitting more and more greenhouse gas, we’d eventually end up running this experiment for real. (Let’s not, please.)
The center of this drama is a particular type of cloud. Stratocumulus clouds typically blanket about a fifth of the low-latitude ocean. Most clouds are formed because air warmed by the Earth’s surface (or forced over mountains) cools as it rises, condensing water vapor to cloud droplets.
Stratocumulus clouds are a little different. The convection that lifts their moisture isn’t driven by warming at the bottom but by cooling at the top.
The water in this cloud deck absorbs much of the infrared radiation emitted upward from the warm surface. The cloud deck re-emits some radiation back downward and some into outer space. The air above these clouds is drier and absorbs much less of the outgoing energy passing through it. That means you can think of these clouds like the cooling fins of a radiator. They shed more heat upward than they receive from the atmosphere above them, allowing them to cool off from the top down. The cold air at the top of the clouds sinks, setting up a convection loop that brings water vapor up from the sea surface to the cloud deck.
The key processes inside these stratocumulus cloud decks happen at a much, much smaller scale than a single grid cell in global climate models, so their physics aren’t simulated directly. Instead, we have a simplified mathematical stand-in for their overall behavior. There is good reason to think this prevents us from understanding the details of how they’ll respond to continued global warming.
To tackle this, Schneider and his colleagues flipped things around. They utilized a model that can simulate these clouds in a small patch of atmosphere—given a simplified version of the world around them. Specifically, they simulated a patch of the subtropical ocean with stratocumulus clouds above and a neighboring patch of tropical ocean responding to global warming. They did this for varying concentrations of greenhouse gas equivalent to 400 parts per million of CO2 (similar to today) on up to 1,600 parts per million.
Up to about 1,000 parts per million, there were no major surprises. Things got around 4°C warmer and numbers changed for things like water vapor and cloud altitude. But the cloud deck generally looked familiar.
At about 1,200 parts per million, however, the simulated clouds suddenly dissipated. And without that shade reflecting sunlight, the world warmed another 8°C.
How is CO2 flipping the switch on these clouds? The researchers found a pair of simple processes working together in their simulation. First, warmer air carries more water vapor up from the sea surface, and when that water vapor condenses, it releases a lot of latent heat. That extra latent heat gives the air a little buoyancy boost, increasing the turbulent movement that can mix dry air from above into the cloud layer. This dries out the cloud deck and makes cloud formation less likely.
Second, the increased CO2 (and water vapor) in the air above the cloud layer means that it absorbs more of the outgoing infrared radiation. Instead of pretty much staying out of the way and allowing the cloud layer to shed heat to space, the upper layer catches more and emits some back towards the clouds.
Both processes weaken the cloud deck, either by slowing the cooling-driven convection or by mixing in dry air. And in the model, the cloud deck just suddenly can’t sustain itself anymore. It breaks up.
From there, the hysteresis is impressive. The warming that results from the loss of these clouds amplifies the processes that broke up the clouds in the first place. Dropping below 1,200 parts per million of CO2 again does not switch the clouds back on. Instead, the researchers had to bring it all the way down to 300 parts per million or so to see the cloud deck reform and stabilize.
It would take around a century of continued emissions growth to hit the equivalent of 1,200 parts per million CO2.
Some other projected trends in circulation would increase the stability of the cloud deck, allowing it to persist to higher CO2 concentrations. The model used in this study—which simplified the global picture to zoom in on one aspect—couldn’t represent those processes. That means the exact numbers aren’t the important thing here. The primary conclusion is that this sudden change in cloud behavior is possible
Climate models are often tested against past periods of climate change—and to study the causes of those climate changes. Efforts to simulate some very warm climates (like the Eocene 50 million years ago) have typically failed to get warm enough, though. To match the warmth indicated by geologic records, models have required higher CO2 than seems to have been present then. It could be that this is what the models are missing—a large temperature boost produced by a loss of marine cloud cover.
Johnson (2022) Striking study finds a climate tipping point in clouds
Schneider Abstract
Stratocumulus clouds cover 20% of the low-latitude oceans and are especially prevalent in the subtropics. They cool the Earth by shading large portions of its surface from sunlight. However, as their dynamical scales are too small to be resolvable in global climate models, predictions of their response to greenhouse warming have remained uncertain. Here we report how stratocumulus decks respond to greenhouse warming in large-eddy simulations that explicitly resolve cloud dynamics in a representative subtropical region. In the simulations, stratocumulus decks become unstable and break up into scattered clouds when CO2 levels rise above 1,200 ppm. In addition to the warming from rising CO2 levels, this instability triggers a surface warming of about 8 K globally and 10 K in the subtropics. Once the stratocumulus decks have broken up, they only re-form once CO2 concentrations drop substantially below the level at which the instability first occurred. Climate transitions that arise from this instability may have contributed importantly to hothouse climates and abrupt climate changes in the geological past. Such transitions to a much warmer climate may also occur in the future if CO2 levels continue to rise.
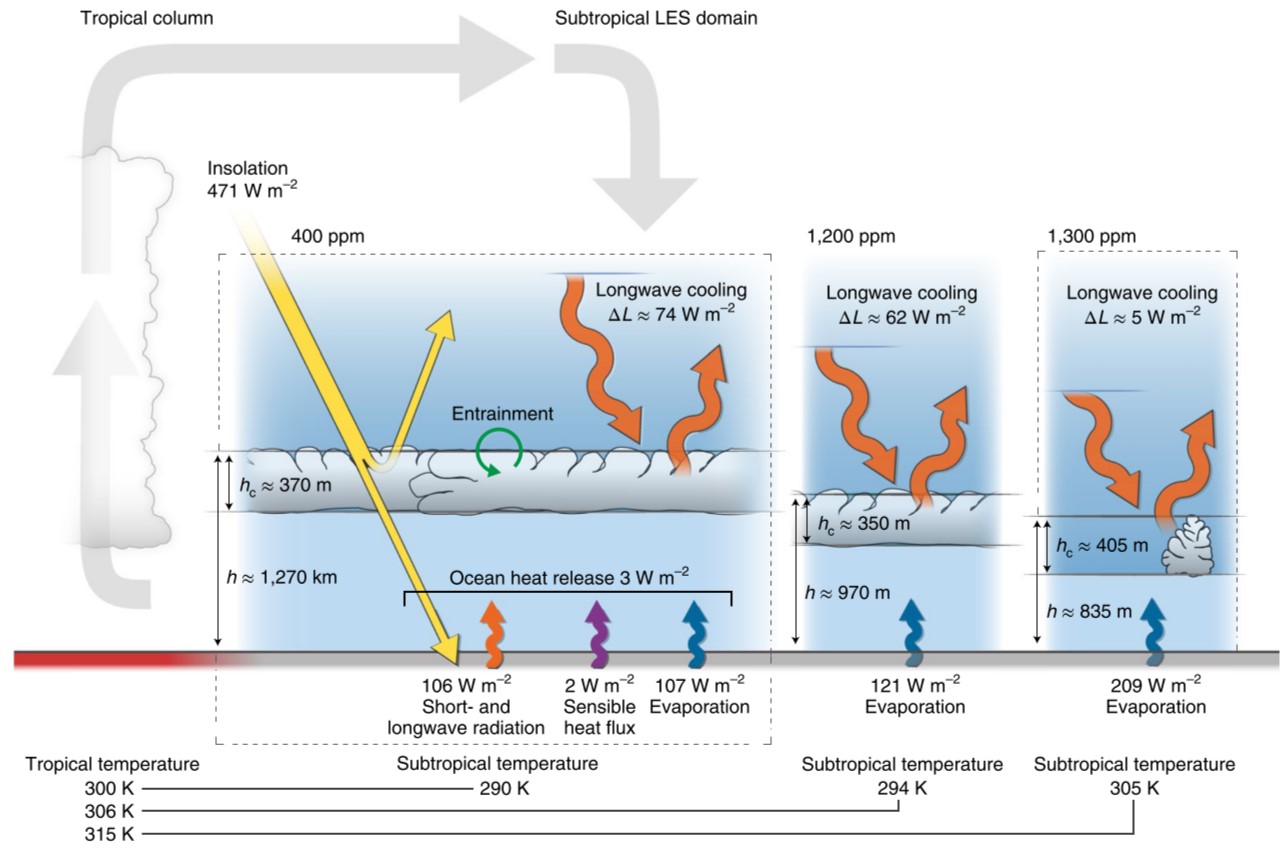
Fig. Simulated subtropical clouds in the present climate (400ppm CO2), at higher CO2 (1,200ppm) and after stratocumulus breakup (1,300ppm). In stratocumulus clouds, longwave radiative cooling of the cloud tops propels air parcels downward, which convectively connects the clouds to their moisture supply at the surface. Turbulence entrains warm and dry air across the inversion, which counteracts the radiative cooling and convective moistening of the cloud layer. When the atmospheric concentration of greenhouse gases (for example, CO2 and H2O) increases (1,200 ppm), the longwave cooling of the cloud tops weakens, because the downwelling longwave radiation that reaches the cloud tops from above emanates at lower levels with higher temperatures relative to the cloud-top temperatures. Eventually, at sufficiently high greenhouse gas concentrations (1,300 ppm in our simulation without subsidence changes), stratocumulus decks break up into cumulus clouds, which leads to dramatic surface warming. Evaporation then strengthens, and the average longwave cooling at the level of the cloud tops drops to less than 10% of its value in the presence of stratocumulus decks.
6.2 Timing Tipping
Guardian
Ecological collapse is likely to start sooner than previously believed, according to a new study that models how tipping points can amplify and accelerate one another.
Based on these findings, the authors warn that more than a fifth of ecosystems worldwide, including the Amazon rainforest, are at risk of a catastrophic breakdown within a human lifetime.
Compared with the long-established and conclusively proven link between fossil fuels and global heating, the science of tipping points and their interactions is relatively undeveloped.
Most studies until now have focused on one driver of destruction, such as climate change or deforestation. But when you combine this with other threats, such as water stress, degradation and river pollution from mining, the breakdown comes much quicker.
Even if one part of an ecosystem is managed sustainably, new stresses such as global warming and extreme weather events could tip the balance towards a collapse.
Previous studies of ecological tipping points suggest significant social and economic costs from the second half of the 21st century onwards. Our findings suggest the potential for these costs to occur much sooner.
This approach – of analysis through system dynamics – also had a positive potential because it showed that small changes in a system could have big impacts.
Guardian (2023) Ecological Tipping Faster
Willcock abstract
A major concern for the world’s ecosystems is the possibility of collapse, where landscapes and the societies they support change abruptly. Accelerating stress levels, increasing frequencies of extreme events and strengthening intersystem connections suggest that conventional modelling approaches based on incremental changes in a single stress may provide poor estimates of the impact of climate and human activities on ecosystems. We conduct experiments on four models that simulate abrupt changes in the Chilika lagoon fishery, the Easter Island community, forest dieback and lake water quality—representing ecosystems with a range of anthropogenic interactions. Collapses occur sooner under increasing levels of primary stress but additional stresses and/or the inclusion of noise in all four models bring the collapses substantially closer to today by ~38–81%. We discuss the implications for further research and the need for humanity to be vigilant for signs that ecosystems are degrading even more rapidly than previously thought.
Willcock memo
The Earth is rapidly destabilizing through ’cascades of collapse.
The potential for rapid destabilization of Earth’s ecosystems is, in part, supported by observational evidence for increasing rates of change in key drivers and interactions between systems at the global scale.
Unstable subsystems are common.
Wilcock (2022) Earlier collapse of Anthropocene ecosystems driven by multiple faster and noisier drivers nature (pdf)