Updated: August 7, 2017
We start out by collecting some facts - initially just from Wikipedia.
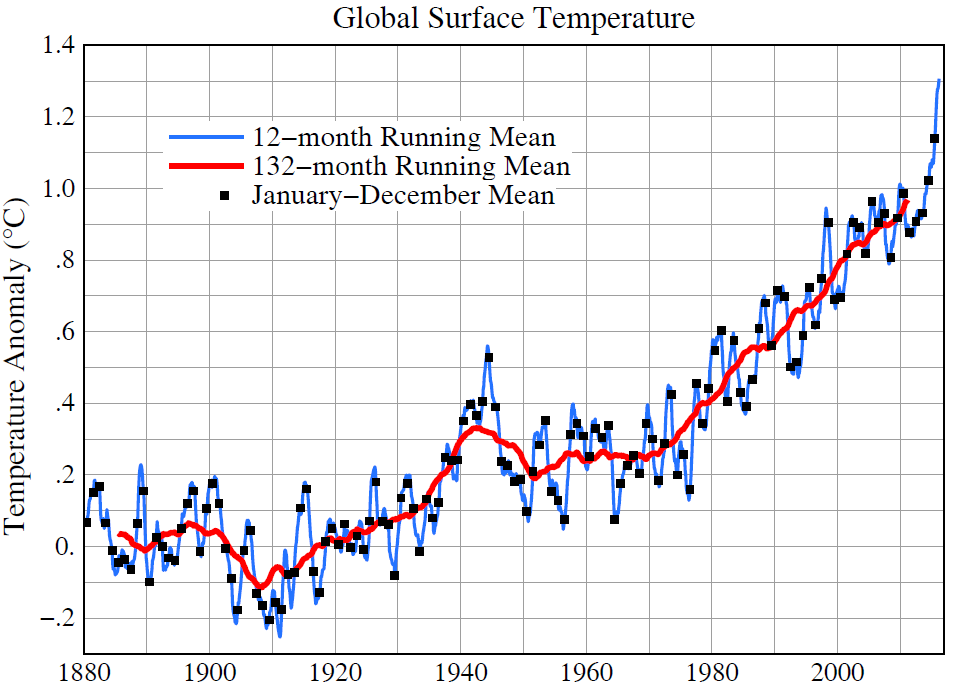
The short view
Global surface temperature 1880 - 2016 as reported by James Hansen and Makiko Sato(2016):
The long view:
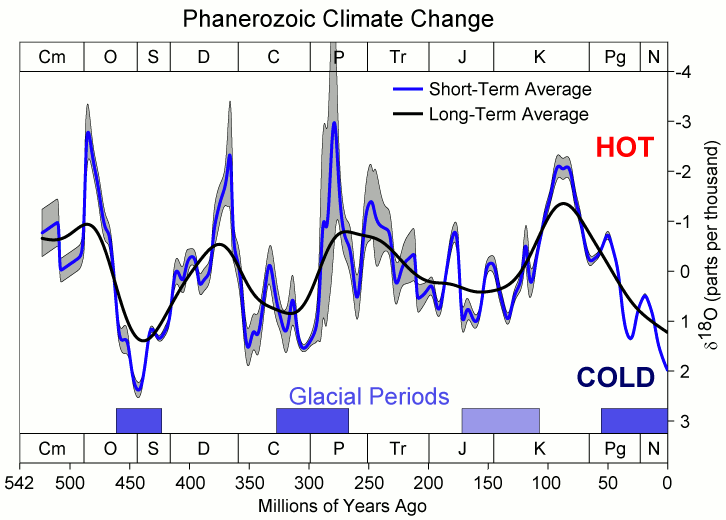
This figure shows the long-term evolution of oxygen isotope ratios during the Phanerozoic eon as measured in fossils, reported by Veizer et al. (1999), and updated online in 2004.[1] Such ratios reflect both the local temperature at the site of deposition and global changes associated with the extent of permanent continental glaciation. As such, relative changes in oxygen isotope ratios can be interpreted as rough changes in climate. Quantitative conversion between these data and direct temperature changes is a complicated process subject to many systematic uncertainties, however it is estimated that each 1 part per thousand change in δ18O represents roughly a 1.5-2 °C change in tropical sea surface temperatures (Veizer et al. 2000). Also shown on this figure are blue bars showing periods when geological criteria (Frakes et al. 1992) indicate cold temperatures and glaciation as reported by Veizer et al. (2000). The Jurassic-Cretaceous period, plotted as a lighter blue bar, was intrepreted as a “cool” period on geological grounds, but the configuration of continents at that time appears to have prevented the formation of large scale ice sheets.
The long-term changes in isotope ratios have been interpreted as a ~140 Myr quasi-periodicity in global climate (Veizer et al. 2000) and some authors (Shaviv and Veizer 2003) have interpreted this periodicity as being driven by the solar system’s motions about the galaxy. Encounters with galactic spiral arms can plausibly lead to a factor of 3 increase in cosmic ray flux. Since cosmic rays are the primary source of ionization in the troposphere, these events can plausibly impact global climate. A major limitation of this theory is that existing measurements can only poorly constrain the timing of encounters with the spiral arms. The more traditional view is that long-term changes in global climate are controlled by geologic forces, and in particular, changes in the configuration of continents as a result of plate tectonics.
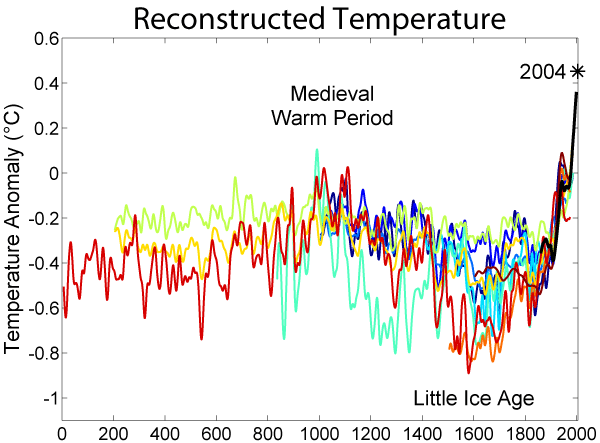
This image is a comparison of 11 different published reconstructions of changes during the last 2000 years. More recent reconstructions are plotted towards the front and in redder colors, older reconstructions appear towards the back and in bluer colors
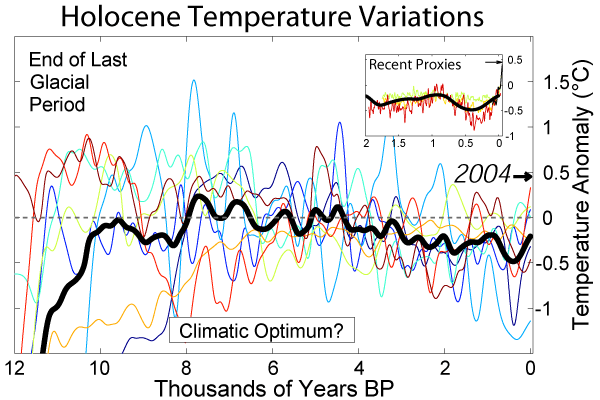
Holocene
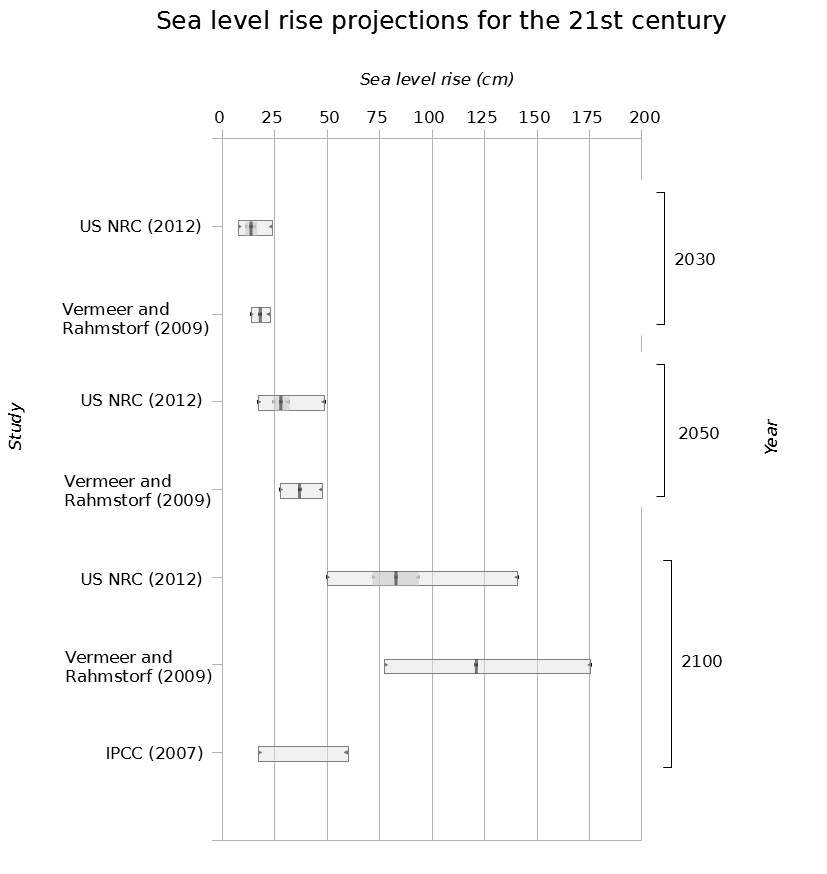
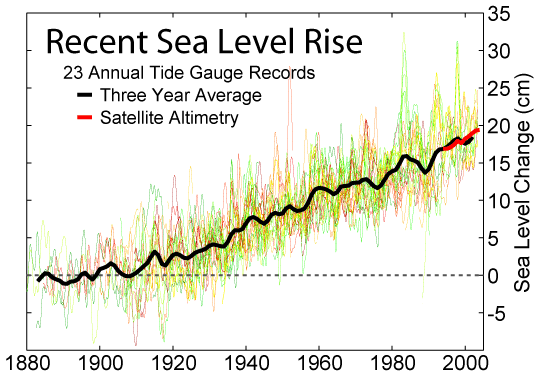
Sea Level
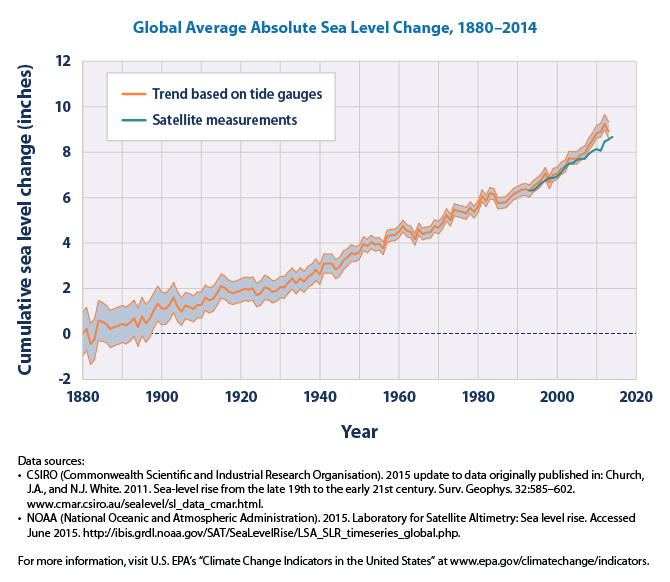
Changes in carbon dioxide associated with continental drift, and the decrease in volcanism as India arrived at the Asian continent, allowed temperatures to drop & Antarctic ice-sheets to form. This resulted in a 75m drop in sea level, allowing our present-day coastlines & habitats to form and stabilize.
…we are already committed to a sea-level rise of approximately 2.3 metres for each degree Celsius of temperature rise within the next 2,000 years …a range of GMSL rise of 0.3 – 2.5 m possible during the 21st century sea level rise
Artic Death Spiral
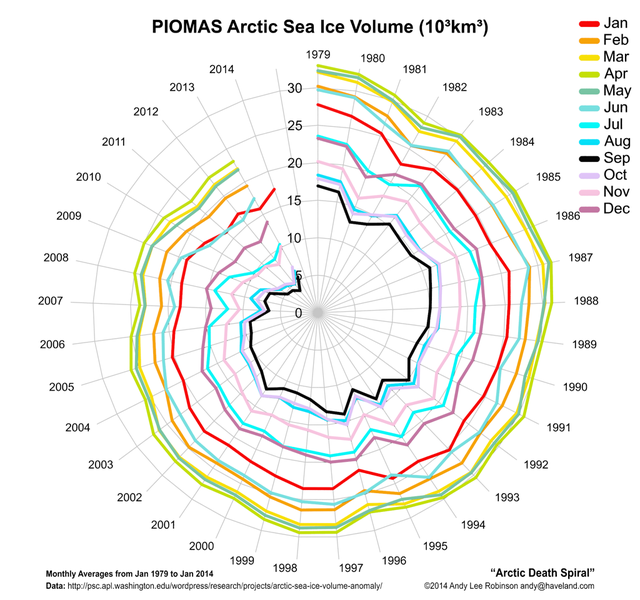
There is an ongoing debate if the Arctic Ocean has already passed a “tipping point”, defined as a threshold for abrupt and irreversible change. A 2013 study identified an abrupt transition to increased seasonal ice cover variability in 2007, which has persisted in following years. The researchers made a distinction between a bifurcation and a non-bifurcation `tipping point’. The IPCC AR5 report stated with medium confidence that precise levels of climate change sufficient to trigger a tipping point remain uncertain, and that the risk associated with crossing multiple tipping points increases with rising temperature
Carbon Dioxide Variations
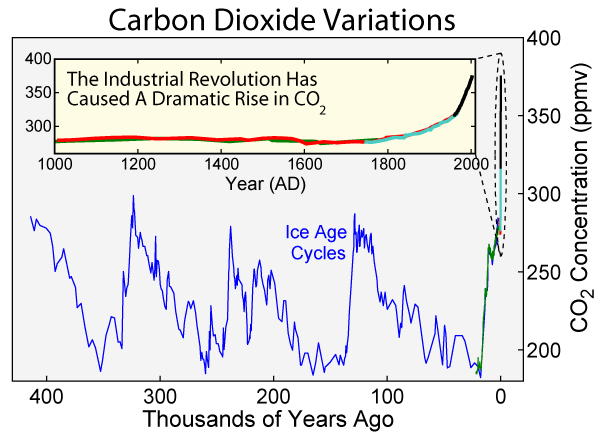
This figure shows the variations in concentration of carbon dioxide (CO2) in the atmosphere during the last 400 thousand years. Throughout most of the record, the largest changes can be related to glacial/interglacial cycles within the current ice age. Although the glacial cycles are most directly caused by changes in the Earth’s orbit (i.e. Milankovitch cycles), these changes also influence the carbon cycle, which in turn feeds back into the glacial system.
Since the Industrial Revolution, circa 1900, the burning of fossil fuels has caused a dramatic increase of CO2 in the atmosphere, reaching levels unprecedented in the last 400 thousand years. This increase has been implicated as a primary cause of global warming.
The spacing of carbon dioxide samples varies through time. At the present, the atmosphere is sampled routinely (at least daily) and complete annual averages are available. From the four ice cores presented on this plot the sampling varies from as rapid as one point every few years (recent parts of the Law Dome record) to as sparse as one sample every few thousand years (oldest parts of the Vostok record). In principle, the sparse sampling in the oldest parts of the record could hide abrupt excursions; however, isotopic measurements of ice cores (which are made continuously along the entire core) and our current understanding of the rates of natural processes for creating and removing carbon dioxide from the atmosphere make it unlikely that any positive excursions in carbon dioxide comparable to the Industrial Revolution have happened during the interval presented above.
Methane Budget
Atmospheric emissions and concentrations of CH 4 continue to increase, making CH 4 the second most important human-influenced greenhouse gas in terms of climate forcing, after carbon dioxide (CO 2 ). The relative importance of CH 4 compared to CO 2 depends on its shorter atmospheric lifetime, stronger warming potential, and variations in atmospheric growth rate over the past decade, the causes of which are still debated. Two major challenges in reducing uncertainties in the atmospheric growth rate arise from the variety of geographically overlapping CH 4 sources and from the destruction of CH 4 by short-lived hydroxyl radicals (OH).
For the 2008–2017 decade, global methane emissions are estimated by atmospheric inversions (a top-down approach) to be 576 Tg CH 4 yr −1 (range 550–594, corresponding to the minimum and maximum estimates of the model ensemble). Of this total, 359 Tg CH 4 yr −1 or ∼ 60 % is attributed to anthropogenic sources, that is emis- sions caused by direct human activity (i.e. anthropogenic emissions; range 336–376 Tg CH 4 yr −1 or 50 %–65 %). The mean annual total emission for the new decade (2008–2017) is 29 Tg CH 4 yr −1 larger than our estimate for the previous decade (2000–2009), and 24 Tg CH 4 yr −1 larger than the one reported in the previous budget for 2003–2012 (Saunois et al., 2016). Since 2012, global CH 4 emissions have been tracking the warmest scenarios assessed by the Intergovernmental Panel on Climate Change. Bottom-up methods suggest almost 30 % larger global emissions (737 Tg CH 4 yr −1 , range 594–881) than top-down inversion methods.
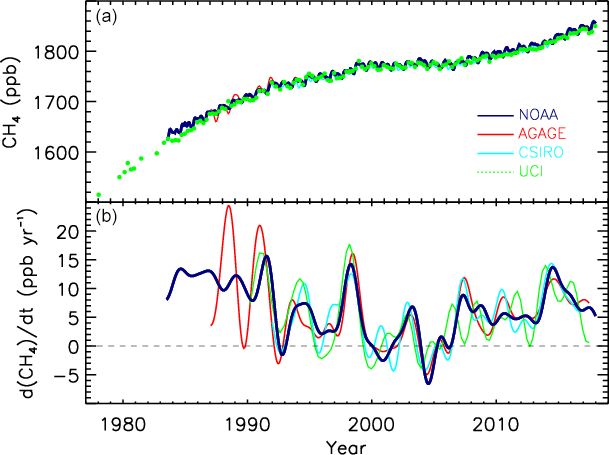
Fig. Globally averaged atmospheric CH4
Global Methane Budget 2000-2017 pdf pdf(SM)
Milankovitch Cycles
Milankovitch cycles describe the collective effects of changes in the Earth’s movements on its climate over thousands of years. The term is named after Serbian geophysicist and astronomer Milutin Milanković. In the 1920s, he theorized that variations in eccentricity, axial tilt, and precession of the Earth’s orbit resulted in cyclical variation in the solar radiation reaching the Earth, and that this orbital forcing strongly influenced climatic patterns on Earth.
100,000 year problem
Of all the orbital cycles, Milankovitch believed that obliquity had the greatest effect on climate, and that it did so by varying the summer insolation in northern high latitudes. Therefore, he deduced a 41,000-year period for ice ages. However, subsequent research has shown that ice age cycles of the Quaternary glaciation over the last million years have been at a 100,000-year period, which matches the eccentricity cycle.
Various explanations for this discrepancy have been proposed, including frequency modulation or various feedbacks (from carbon dioxide, cosmic rays, or from ice sheet dynamics). Some models can reproduce the 100,000-year cycles as a result of non-linear interactions between small changes in the Earth’s orbit and internal oscillations of the climate system.
Jung-Eun Lee of Brown University proposes that precession changes the amount of energy that Earth absorbs, because the southern hemisphere’s greater ability to grow sea ice reflects more energy away from Earth. Moreover, Lee says, “Precession only matters when eccentricity is large. That’s why we see a stronger 100,000-year pace than a 21,000-year pace.”
Some have argued that the length of the climate record is insufficient to establish a statistically significant relationship between climate and eccentricity variations.
Climate Change Feedbacks
Artifacts show that the variation in Earth’s climate is much more extreme than the variation in the intensity of solar radiation calculated as the Earth’s orbit evolves. If orbital forcing causes climate change, science needs to explain why the observed effect is amplified compared to the theoretical effect.
Some climate systems exhibit amplification (positive feedback) and damping responses (negative feedback). An example of amplification would be if, with the land masses around 65° north covered in year-round ice, solar energy were reflected away. Amplification would mean that an ice age induces changes that impede orbital forcing from ending the ice age.
The Earth’s current orbital inclination is 1.57° (see above). Earth presently moves through the invariable plane around January 9 and July 9. At these times, there is an increase in meteors and noctilucent clouds. If this is because there is a disk of dust and debris in the invariable plane, then when the Earth’s orbital inclination is near 0° and it is orbiting through this dust, materials could be accreted into the atmosphere. This process could explain the narrowness of the 100,000-year climate cycle.
Carbon Cycle Feedbacks
here have been predictions, and some evidence, that global warming might cause loss of carbon from terrestrial ecosystems, leading to an increase of atmospheric CO2 levels. Several climate models indicate that global warming through the 21st century could be accelerated by the response of the terrestrial carbon cycle to such warming.[7] All 11 models in the C4MIP study found that a larger fraction of anthropogenic CO2 will stay airborne if climate change is accounted for. By the end of the twenty-first century, this additional CO2 varied between 20 and 200 ppm for the two extreme models, the majority of the models lying between 50 and 100 ppm. The higher CO2 levels led to an additional climate warming ranging between 0.1° and 1.5 °C. However, there was still a large uncertainty on the magnitude of these sensitivities. Eight models attributed most of the changes to the land, while three attributed it to the ocean.[8] The strongest feedbacks in these cases are due to increased respiration of carbon from soils throughout the high latitude boreal forests of the Northern Hemisphere. One model in particular (HadCM3) indicates a secondary carbon cycle feedback due to the loss of much of the Amazon Rainforest in response to significantly reduced precipitation over tropical South America.[9] While models disagree on the strength of any terrestrial carbon cycle feedback, they each suggest any such feedback would accelerate global warming.
Observations show that soils in the U.K have been losing carbon at the rate of four million tonnes a year for the past 25 years[10] according to a paper in Nature by Bellamy et al. in September 2005, who note that these results are unlikely to be explained by land use changes. Results such as this rely on a dense sampling network and thus are not available on a global scale. Extrapolating to all of the United Kingdom, they estimate annual losses of 13 million tons per year. This is as much as the annual reductions in carbon dioxide emissions achieved by the UK under the Kyoto Treaty (12.7 million tons of carbon per year).[11]
It has also been suggested (by Chris Freeman) that the release of dissolved organic carbon (DOC) from peat bogs into water courses (from which it would in turn enter the atmosphere) constitutes a positive feedback for global warming. The carbon currently stored in peatlands (390–455 gigatonnes, one-third of the total land-based carbon store) is over half the amount of carbon already in the atmosphere.[12] DOC levels in water courses are observably rising; Freeman’s hypothesis is that, not elevated temperatures, but elevated levels of atmospheric CO2 are responsible, through stimulation of primary productivity.[13][14]
Tree deaths are believed to be increasing as a result of climate change, which is a positive feedback effect.[15] This contradicts the previously widely held view that increased natural vegetation would lead to a negative-feedback effect.
El Niño
El Niño–Southern Oscillation (ENSO) is a global coupled ocean-atmosphere phenomenon. The Pacific Ocean signatures, El Niño and La Niña are important temperature fluctuations in surface waters of the tropical Eastern Pacific Ocean. The name El Niño, from the Spanish for “the little boy”, refers to the Christ child, because the phenomenon is usually noticed around Christmas time in the Pacific Ocean off the west coast of South America.[5] La Niña means “the little girl”.[6] Their effect on climate in the subtropics and the tropics are profound. The atmospheric signature, the Southern Oscillation (SO) reflects the monthly or seasonal fluctuations in the air pressure difference between Tahiti and Darwin. The most recent occurrence of El Niño started in September 2006[7] and lasted until early 2007.[8]
ENSO is a set of interacting parts of a single global system of coupled ocean-atmosphere climate fluctuations that come about as a consequence of oceanic and atmospheric circulation. ENSO is the most prominent known source of inter-annual variability in weather and climate around the world. The cycle occurs every two to seven years, with El Niño lasting nine months to two years within the longer term cycle,[9] though not all areas globally are affected. ENSO has signatures in the Pacific, Atlantic and Indian Oceans.
In the Pacific, during major warm events, El Niño warming extends over much of the tropical Pacific and becomes clearly linked to the SO intensity. While ENSO events are basically in phase between the Pacific and Indian Oceans, ENSO events in the Atlantic Ocean lag behind those in the Pacific by 12–18 months. Many of the countries most affected by ENSO events are developing countries within tropical sections of continents with economies that are largely dependent upon their agricultural and fishery sectors as a major source of food supply, employment, and foreign exchange.[10] New capabilities to predict the onset of ENSO events in the three oceans can have global socio-economic impacts. While ENSO is a global and natural part of the Earth’s climate, whether its intensity or frequency may change as a result of global warming is an important concern. Low-frequency variability has been evidenced: the quasi-decadal oscillation (QDO). Inter-decadal (ID) modulation of ENSO (from PDO or IPO) might exist. This could explain the so-called protracted ENSO of the early 1990s.
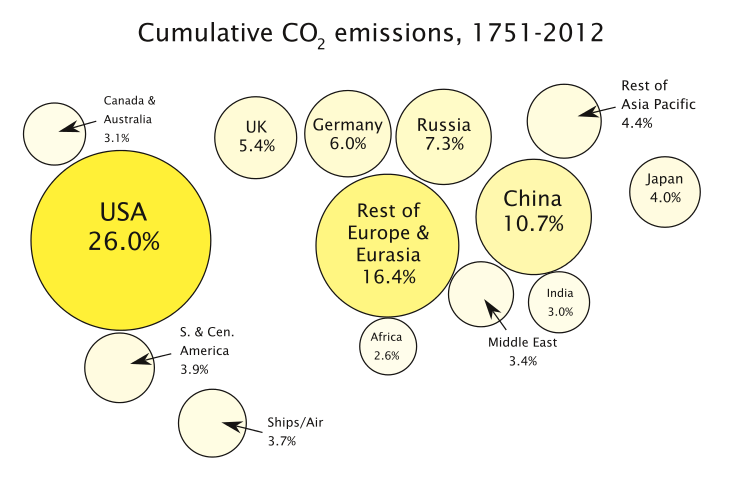
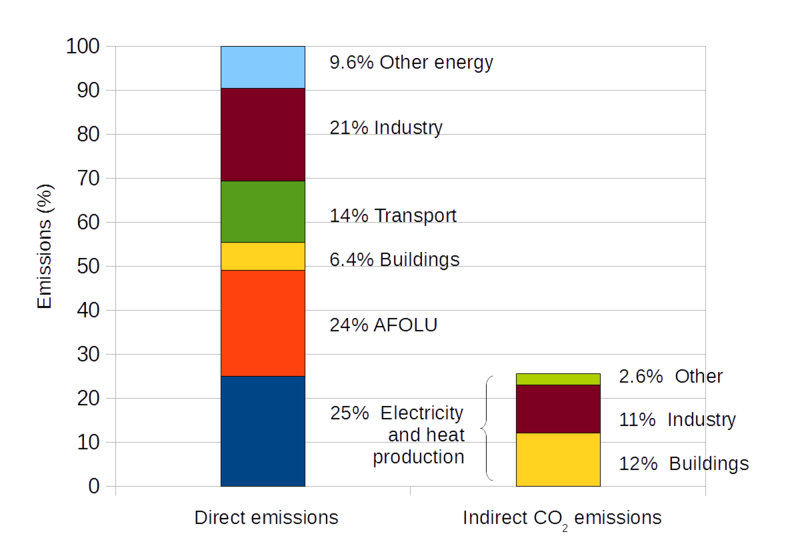
CO2 Regions and Sectors
Greenhouse effect
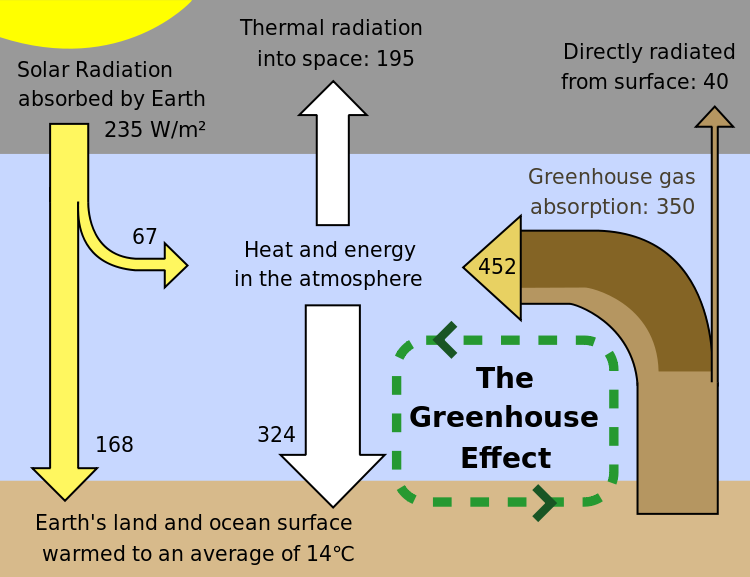
On Earth, an atmosphere containing naturally occurring amounts of greenhouse gases causes air temperature near the surface to be about 33 °C (59 °F) warmer than it would be in their absence.[60][d] Without the Earth’s atmosphere, the Earth’s average temperature would be well below the freezing temperature of water.[61] The major greenhouse gases are water vapour, which causes about 36–70% of the greenhouse effect; carbon dioxide (CO2), which causes 9–26%; methane (CH4), which causes 4–9%; and ozone (O3), which causes 3–7%.[62][63][64] Clouds also affect the radiation balance through cloud forcings similar to greenhouse gases.
Human activity since the Industrial Revolution has increased the amount of greenhouse gases in the atmosphere, leading to increased radiative forcing from CO2, methane, tropospheric ozone, CFCs and nitrous oxide. According to work published in 2007, the concentrations of CO2 and methane had increased by 36% and 148% respectively since 1750.[65] These levels are much higher than at any time during the last 800,000 years, the period for which reliable data has been extracted from ice cores.[66][67][68][69] Less direct geological evidence indicates that CO2 values higher than this were last seen about 20 million years ago.[70]
Fossil fuel burning has produced about three-quarters of the increase in CO2 from human activity over the past 20 years. The rest of this increase is caused mostly by changes in land-use, particularly deforestation.[71] Another significant non-fuel source of anthropogenic CO2 emissions is the calcination of limestone for clinker production, a chemical process which releases CO2.[72] Estimates of global CO2 emissions in 2011 from fossil fuel combustion, including cement production and gas flaring, was 34.8 billion tonnes (9.5 ± 0.5 PgC), an increase of 54% above emissions in 1990. Coal burning was responsible for 43% of the total emissions, oil 34%, gas 18%, cement 4.9% and gas flaring 0.7%[73]
In May 2013, it was reported that readings for CO2 taken at the world’s primary benchmark site in Mauna Loa surpassed 400 ppm. According to professor Brian Hoskins, this is likely the first time CO2 levels have been this high for about 4.5 million years.[74][75] Monthly global CO2 concentrations exceeded 400 ppm in March 2015, probably for the first time in several million years.[76] On 12 November 2015, NASA scientists reported that human-made carbon dioxide continues to increase above levels not seen in hundreds of thousands of years: currently, about half of the carbon dioxide released from the burning of fossil fuels is not absorbed by vegetation and the oceans and remains in the atmosphere.[77] Global carbon dioxide emissions by country.
Over the last three decades of the twentieth century, gross domestic product per capita and population growth were the main drivers of increases in greenhouse gas emissions.[78] CO2 emissions are continuing to rise due to the burning of fossil fuels and land-use change.[79][80]:71 Emissions can be attributed to different regions. Attributions of emissions due to land-use change are subject to considerable uncertainty.[81][82]:289
Emissions scenarios, estimates of changes in future emission levels of greenhouse gases, have been projected that depend upon uncertain economic, sociological, technological, and natural developments.[83] In most scenarios, emissions continue to rise over the century, while in a few, emissions are reduced.[84][85] Fossil fuel reserves are abundant, and will not limit carbon emissions in the 21st century.[86] Emission scenarios, combined with modelling of the carbon cycle, have been used to produce estimates of how atmospheric concentrations of greenhouse gases might change in the future. Using the six IPCC SRES “marker” scenarios, models suggest that by the year 2100, the atmospheric concentration of CO2 could range between 541 and 970 ppm.[87] This is 90–250% above the concentration in the year 1750.
The popular media and the public often confuse global warming with ozone depletion, i.e., the destruction of stratospheric ozone (e.g., the ozone layer) by chlorofluorocarbons.[88][89] Although there are a few areas of linkage, the relationship between the two is not strong. Reduced stratospheric ozone has had a slight cooling influence on surface temperatures, while increased tropospheric ozone has had a somewhat larger warming effect.
Solar Output
Solar output also varies on shorter time scales, including the 11-year solar cycle[40] and longer-term modulations.[41] Solar intensity variations possibly as a result of the Wolf, Spörer and Maunder Minimum are considered to have been influential in triggering the Little Ice Age,[42] and some of the warming observed from 1900 to 1950. The cyclical nature of the Sun’s energy output is not yet fully understood; it differs from the very slow change that is happening within the Sun as it ages and evolves. Research indicates that solar variability has had effects including the Maunder minimum from 1645 to 1715 A.D., part of the Little Ice Age from 1550 to 1850 A.D. that was marked by relative cooling and greater glacier extent than the centuries before and afterward.[43][44] Some studies point toward solar radiation increases from cyclical sunspot activity affecting global warming, and climate may be influenced by the sum of all effects (solar variation, anthropogenic radiative forcings, etc.).[45][46]
Interestingly, a 2010 study[47] suggests, “that the effects of solar variability on temperature throughout the atmosphere may be contrary to current expectations.”
In an Aug 2011 Press Release,[48] CERN announced the publication in the Nature journal the initial results from its CLOUD experiment. The results indicate that ionisation from cosmic rays significantly enhances aerosol formation in the presence of sulfuric acid and water, but in the lower atmosphere where ammonia is also required, this is insufficient to account for aerosol formation and additional trace vapours must be involved. The next step is to find more about these trace vapours, including whether they are of natural or human origin.
Volcanism
The eruptions considered to be large enough to affect the Earth’s climate on a scale of more than 1 year are the ones that inject over 100,000 tons of SO2 into the stratosphere. This is due to the optical properties of SO2 and sulfate aerosols, which strongly absorb or scatter solar radiation, creating a global layer of sulfuric acid haze. On average, such eruptions occur several times per century, and cause cooling (by partially blocking the transmission of solar radiation to the Earth’s surface) for a period of a few years.
The eruption of Mount Pinatubo in 1991, the second largest terrestrial eruption of the 20th century, affected the climate substantially, subsequently global temperatures decreased by about 0.5 °C (0.9 °F) for up to three years. Thus, the cooling over large parts of the Earth reduced surface temperatures in 1991–93, the equivalent to a reduction in net radiation of 4 watts per square meter. The Mount Tambora eruption in 1815 caused the Year Without a Summer. Much larger eruptions, known as large igneous provinces, occur only a few times every fifty – one hundred million years – through flood basalt, and caused in Earth past global warming and mass extinctions.
Small eruptions, with injections of less than 0.1 Mt of sulfur dioxide into the stratosphere, impact the atmosphere only subtly, as temperature changes are comparable with natural variability. However, because smaller eruptions occur at a much higher frequency, they too have a significant impact on Earth’s atmosphere.
Seismic monitoring maps current and future trends in volcanic activities, and tries to develop early warning systems. In climate modelling the aim is to study the physical mechanisms and feedbacks of volcanic forcing.
Volcanoes are also part of the extended carbon cycle. Over very long (geological) time periods, they release carbon dioxide from the Earth’s crust and mantle, counteracting the uptake by sedimentary rocks and other geological carbon dioxide sinks. The US Geological Survey estimates are that volcanic emissions are at a much lower level than the effects of current human activities, which generate 100–300 times the amount of carbon dioxide emitted by volcanoes.[58] A review of published studies indicates that annual volcanic emissions of carbon dioxide, including amounts released from mid-ocean ridges, volcanic arcs, and hot spot volcanoes, are only the equivalent of 3 to 5 days of human-caused output. The annual amount put out by human activities may be greater than the amount released by supererruptions, the most recent of which was the Toba eruption in Indonesia 74,000 years ago.
Although volcanoes are technically part of the lithosphere, which itself is part of the climate system, the IPCC explicitly defines volcanism as an external forcing agent.[
Plate tectonics
Over the course of millions of years, the motion of tectonic plates reconfigures global land and ocean areas and generates topography. This can affect both global and local patterns of climate and atmosphere-ocean circulation.[61]
The position of the continents determines the geometry of the oceans and therefore influences patterns of ocean circulation. The locations of the seas are important in controlling the transfer of heat and moisture across the globe, and therefore, in determining global climate. A recent example of tectonic control on ocean circulation is the formation of the Isthmus of Panama about 5 million years ago, which shut off direct mixing between the Atlantic and Pacific Oceans. This strongly affected the ocean dynamics of what is now the Gulf Stream and may have led to Northern Hemisphere ice cover.[62][63] During the Carboniferous period, about 300 to 360 million years ago, plate tectonics may have triggered large-scale storage of carbon and increased glaciation.[64] Geologic evidence points to a “megamonsoonal” circulation pattern during the time of the supercontinent Pangaea, and climate modeling suggests that the existence of the supercontinent was conducive to the establishment of monsoons.[65]
The size of continents is also important. Because of the stabilizing effect of the oceans on temperature, yearly temperature variations are generally lower in coastal areas than they are inland. A larger supercontinent will therefore have more area in which climate is strongly seasonal than will several smaller continents or islands.
Ice Age
…small increases in greenhouse gases due to the expansion of agriculture that started 8,000 years ago have in fact delayed the next ice age. What’s more, if we continue emitting greenhouse gases at the same rate, we might have put off the next ice age for at least half a million years.