46 Phillips Curve
Ratner Abstract
Is the Phillips curve dead? If so, who killed it? Conventional wisdom has it that the sound monetary policy since the 1980s not only conquered the Great Inflation, but also buried the Phillips curve itself. This paper provides an alternative explanation: labor market policies that have eroded worker bargaining power might have been the source of the demise of the Phillips curve. We develop what we call the “Kaleckian Phillips curve”, the slope of which is determined by the bargaining power of trade unions. We show that a nearly 90 percent reduction in inflation volatility is possible even without any changes in monetary policy when the economy transitions from equal shares of power between workers and firms to a new balance in which firms dominate. In addition, we show that the decline of trade union power reduces the share of monopoly rents appropriated by workers, and thus helps explain the secular decline of labor share, and the rise of profit share. We provide time series and cross sectional evidence.
Ratner (2022) Who killed the Phillips Curve (pdf) (pdf Slides)
Seccareccia on Rattner
A repeat of the anti-inflation policy scenario of the early 1980s of sharply raising central bank interest rates might prove inappropriate, if not catastrophic, as solution to dealing with the current inflationary environment.
Seccareccia (2022) The Fed Tackles Kalecki
46.1 Unemployment and interest rates
Fix
Prior to 1970, there was essentially no connection between unemployment and bond yields. But from 1980 to the late 2000s, there was a one-to-one connection. In other words, just as bond yields started to move with unemployment, economists began to connect unemployment with the rate of interest.
Given economists’ penchant for reactionary fads, it seems plausible that the interest-rate-unemployment nexus is not a general truth. Instead, it may have been a theoretical reaction to a transient period in US history.
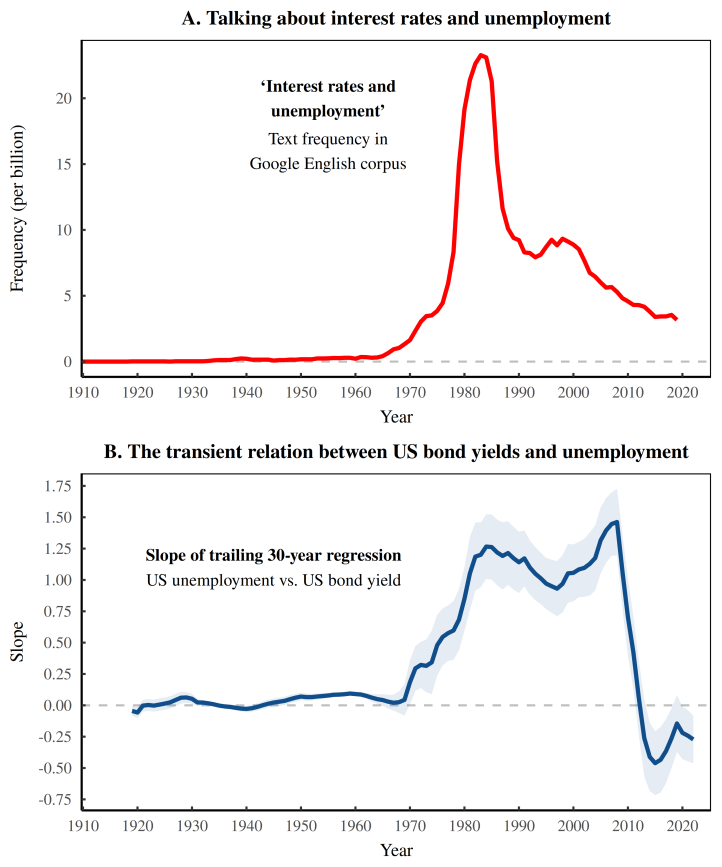
Fig: The rise of the interest-rate-unemployment nexus. This figure traces the connection between interest rates and unemployment to a particular moment in US history. Panel A shows the frequency of the phrase ‘interest rates and unemployment’ in the Google English corpus. (I’ve included in this measurement the frequency for the conjugate phrase ‘unemployment and interest rates’.) The phrase exploded in popularity during the 1980s. Around the same time, there was a shift in how US interest rates related to unemployment. Panel B quantifies this shift by plotting the slope of the trailing 30-year regression between unemployment and the US bond yield. When this slope is zero, bond yields don’t respond to unemployment. But when this slope is one, bond yields show a one-to-one response to unemployment.
When it comes to monetary policy, economists have been taught that the effects come with lags that are ‘long and variable’. So if I don’t do a lag analysis, I’ll get an endless stream of requests to ‘lag the data’. Let me preempt that torture.
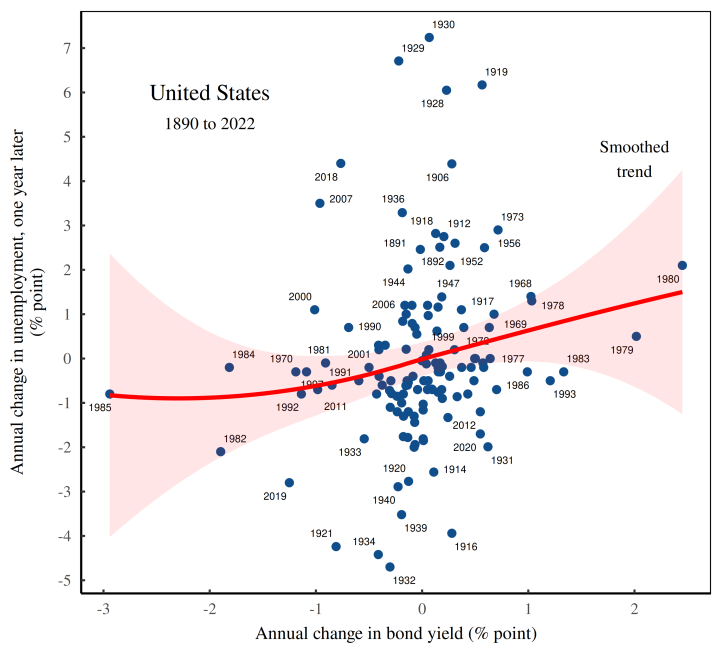
Fig: Changes in the US bond yield predict jumps in next-year’s unemployment. The relation between changes in the US bond yield (horizontal axis) and changes in next-year’s unemployment (vertical axis). The red line shows the smoothed trend. The red shaded region shows the associated uncertainty in the trend, which is significant.
The caveat here is that the lagged trend is produced in large part by a few outlier years, all of which are in the late 1970s and the early 1980s. It’s dubious to take a pattern from that decade and pronounce it a ‘general tendency’. Things get worse when we realize that a lagged effect doesn’t mean much on its own. That’s because when we’re dealing with cyclical data, we’ll inevitably find that an observation today predicts an observation later.
n the case of a one year lag, it’s fairly easy to understand what we’ll observe. In the US, unemployment oscillates with a roughly 8-year cycle. In that context, a one year lag represents an eighth of a cycle. If we do the math, we find that an uptick in this year’s unemployment should be followed by another uptick next year. In other words, changes in unemployment this year ought to correlate positively with unemployment changes next year. And indeed they do.
I have to admit that I find these results disappointing. Although I’ve learned to take economists’ pontifications with a boulder of salt, my intuition was that interest rates would connect with unemployment And yet the evidence suggests otherwise.
That said, there are ways to connect interest income to unemployment — ways that are better supported by evidence. In my next post, I’ll discuss Jonathan Nitzan and Shimshon Bichler’s concept of the ‘maturity of capitalism’, which pits interest income against profit income. It turns out that unlike interest rates, the interest-to-profit income ratio is related to unemployment.
The point is that measurements must take into account the social order that they are quantifying. On that front, if we divide society into the ‘employed’ and the ‘unemployed’, we’re excluding a third category: the shittily employed. As big corporations increasingly turn to ‘flexible’ labor to do their bidding, we’d best pay attention to this third category.
Fix (2023) Interest Rates and Unemployment: An Underwhelming Relation