8 Extractives
8.1 Material and Energy Productivity
Steinberger Abstract
Resource productivity, measured as GDP output per resource input, is a widespread sustainability indicator combining economic and environmental information. Resource productivity is ubiquitous, from the IPAT identity to the analysis of dematerialization trends and policy goals. High resource productivity is interpreted as the sign of a resource-efficient, and hence more sustainable, economy. Its inverse, resource intensity (resource per GDP) has the reverse behavior, with higher values indicating environmentally inefficient economies. In this study, we investigate the global systematic relationship between material, energy and carbon productivities, and economic activity. We demonstrate that different types of materials and energy exhibit fundamentally different behaviors, depending on their international income elasticities of consumption. Biomass is completely inelastic, whereas fossil fuels tend to scale proportionally with income. Total materials or energy, as aggregates, have intermediate behavior, depending on the share of fossil fuels and other elastic resources. We show that a small inelastic share is sufficient for the total resource productivity to be significantly correlated with income. Our analysis calls into question the interpretation of resource productivity as a sustainability indicator. We conclude with suggestions for potential alternatives.
8.2 Physical Economy of United States
Gierlinger
This article explores the long-term historical development of the physical economy of the United States and the evolution of its industrial metabolism.
No dematerialization
The United States is not only the world’s largest economy, but it is also one of the world’s largest consumers of natural resources. The country, which is inhabited by some 5% of the world’s population, uses roughly one-fifth of the global primary energy supply and 15% of all extracted materials. This article explores long-term trends and patterns of material use in the United States. Based on a material flow account (MFA) that is fully consistent with current standards of economy-wide MFAs and covers domestic extraction, imports, and exports of materials for a 135-year period, we investigated the evolution of the U.S. industrial metabolism. This process was characterized by an 18-fold increase in material consumption, a multiplication of material use per capita, and a shift from renewable biomass toward mineral and fossil resources. In spite of considerable improvements in material intensity, no dematerialization has happened so far; in contrast to other high-income countries, material use has not stabilized since the 1970s, but has continued to grow. This article compares patterns and trends of material use in the United States with those in Japan and the United Kingdom and discusses the factors underlying the disproportionately high level of U.S. per capita resource consumption.
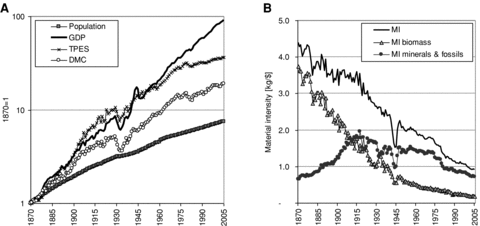
Figure: Material use and economic development in the United States: (a) development of population, gross domestic product (GDP),domestic material consumption (DMC), and total primary energy supply (TPES); and (b) material intensity (MI) in kilograms per unit GDP. MI is defined as DMC/GDP. Note the logarithmic scale
8.3 Mining
8.3.1 Battery Metals
Beslik
Rare earth metals are at the core of every major technology today. Smartphones, laptops, wind turbines, electric cars, and medical devices, you name it.
They’re also widely used in defence technology like jets and guided missile systems. Rare earth metals are essential to modern technology.
It’s important to distinguish between: ‘rare-’, ‘precious-’, and ‘critical-’ earth elements. The terms are not interchangeable, but unfortunately often are in popular media.
It’s also important to distinguish between ‘reserves’ and ‘resources’. Reserves denote the amount that can be technically recovered at a cost that is financially feasible at the present price. Resources include all that can be technically recovered at any price.
Electric vehicles typically use two precious earth metals: gold and silver. These are used in minute quantities in the circuit boards, which also occurs in modern fossil fuelled vehicles. The circuit boards run the electronics. These valuable metals are fully recyclable.
Critical earth elements typically found in EV batteries are: lithium and cobalt, both fully recyclable. Both Lithium and cobalt metals can be reused over and over repeatedly. These two elements are not particularly rare – cobalt can be found in most rocks, and lithium is the first metal in the periodic table and one of only three elements created in the primordial Big Bang. Lithium is the 32nd most common element on our planet.
But both metals are critical because of modern societies’ dependence on lithium-ion battery technology for mobile phones, laptops, and now EVs. And also, in the case of cobalt, because of geopolitics: the bulk of the cobalt supply comes from the politically unstable Democratic Republic of Congo. While there are plenty of lithium and cobalt resources, there are fewer reserves of them. Cobalt is a by-product of nickel and copper mines, and is therefore dependent on the economic viability of those mining operations.
Worldwide sources of lithium are broken down by ore-deposit type as follows: closed-basin brines, 58%; pegmatites and related granites, 26%; lithium-enriched clays, 7%; oilfield brines, 3%; geothermal brines, 3%; and lithium-enriched zeolites, 3% (2013 statistics USGS). Of those, closed basin brines are the most important source of lithium reserves.
Put simplistically, dissolved lithium salts are most commonly mined by drilling down to underground saline deposits and pumping the saline to the surface where it is left to dry in the desert sun, before being processed into lithium metal (and other elements, like potash and magnesium).
China currently holds a near monopoly on supply. China mines 94-97% of the rare earth metals globally and, while efforts have increased in America and Europe to find alternative supplies, there are still no clear avenues to diversifying supply. China has become the world’s largest producer simply because Western nations don’t want to do the dirty work that is required to produce rare earths.
The reason most often cited for this shift to China is cheap labour. However another, which is often tacitly acknowledged, is lack of environmental regulation. This has meant that costs associated with proper environmental protection – required if manufacturing occurred in the west – have not been built in to the price of goods.
Australia has substantial rare element deposits. However, the current major Australia processing operation involves a site in Malaysia. This controversial project by Lynas has sparked a major local environmental protest campaign led by Malay residents concerned about environmental and health impacts.
Rare earth metals are currently extracted through mining, which comes with a number of downsides. First, it’s costly and inefficient because extracting even a very small amount of rare earth metals requires large areas to be mined. Second, the process can have enormous environmental impacts. Mining for rare earth minerals generates large volumes of toxic and radioactive material, due to the co-extraction of thorium and uranium, radioactive metals which cause problems for the environment and human health.
These are the locations where the mining of battery metals is taking place.